
In 2020, researchers from Huashan Hospital of Fudan University in Shanghai, East Hospital Affiliated to Tongji University, Auburn University in the United States and other institutions published an article titled “Circulating tumor cell characterization of lung cancer brain metastases in the cerebrospinal fluid through single-cell transcriptome analysis” in the journal “Clinical and Translational Medicine”.
The researchers established an effective method for collecting cerebrospinal fluid circulating tumor cells (CSF-CTCs) and isolated single cerebrospinal fluid cells from 5 patients with leptomeningeal metastases of lung adenocarcinoma (LUAD-LM) and 3 control groups. They used the Smart-seq2 technology to conduct single-cell sequencing on 3,792 cells and comprehensively characterized the gene expression of cerebrospinal fluid cells. After filtering out low-quality cells, the article analyzed 207 normal cerebrospinal fluid cells, 41 B cells and 41 T cells. On average, 803 gene expressions were detected in each cell. Cluster analysis revealed that normal lymphocytes had similar expression profiles under different microenvironments. No B cells were found in normal cerebrospinal fluid samples.
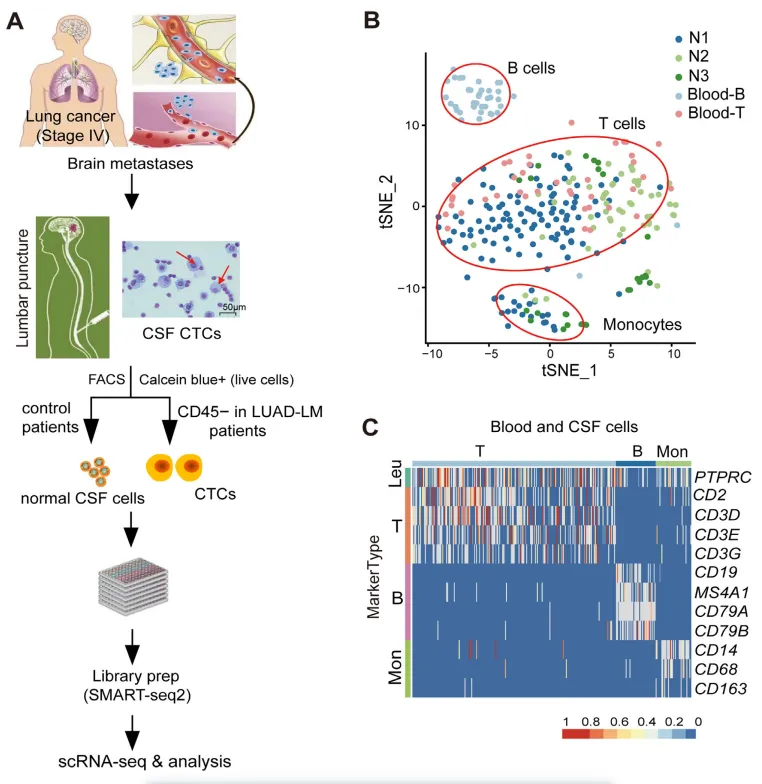
Figure 1. Isolation of cerebrospinal fluid circulating tumor cells (CFS-CTCs) and the composition of normal cerebrospinal fluid cells.
On March 2, 2021, the team led by Professor Zhang Zemin from Peking University published a research paper titled “Direct Comparative Analyses of 10x Genomics Chromium and Smart-seq2” in Genomics Proteomics Bioinformatics. In this study, two single-cell transcriptome sequencing technologies, Smart-seq2 and 10x Genomics Chromium, were used to conduct a comparative analysis of CD45- cells sorted by flow cytometry in liver cancer (LT) and its adjacent non-tumor (NT) tissues from a patient with hepatocellular carcinoma (HCC), as well as in rectal cancer (PT) and liver metastasis (MT) tissues from a patient with rectal cancer accompanied by liver metastasis. Differences between the two were analyzed from multiple perspectives, providing a basis for the selection and application of single-cell transcriptome sequencing technologies.
The dropout rate in 10x was higher than that in Smart-seq2. Taking the HK gene in LT cells as an example, the dropout rate in 10x was also higher than that in Smart-seq2. Genes with lower expression levels had higher dropout rates. In 10x, genes with lower abundances were detected from a smaller number of cells, and these genes might lead to higher noise. The authors also found that the coefficient of variation (CV) of gene expression was related to the dropout rate (CV is often used to measure the expression variation of a gene in certain samples). Genes with larger CVs usually had lower expressions, especially for 10x. Meanwhile, genes with larger CVs also had higher dropout rates.
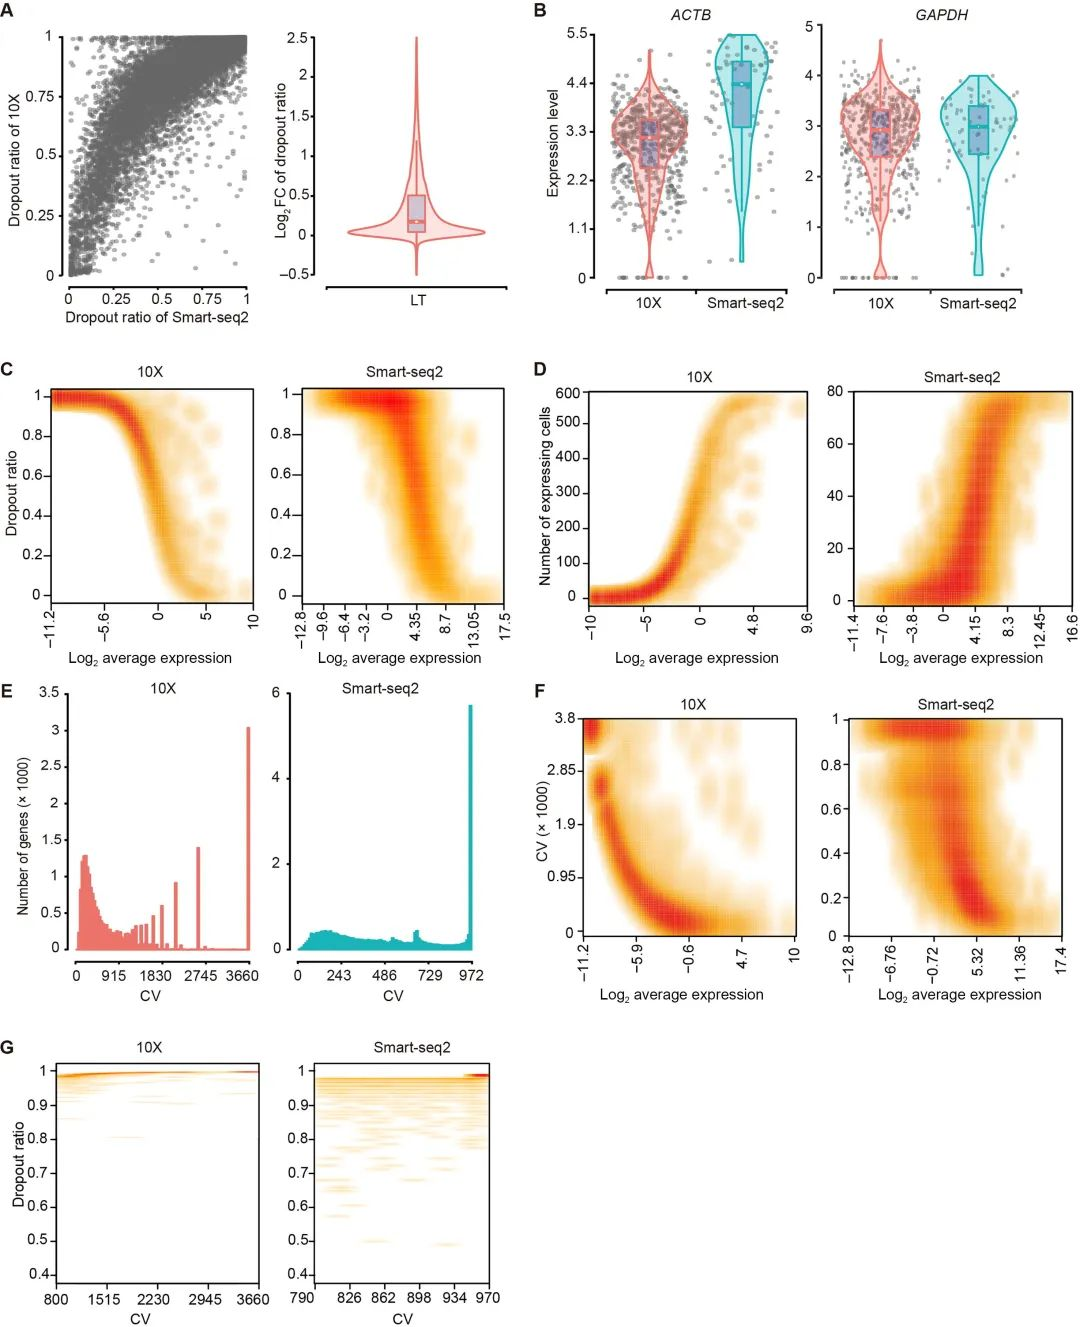
Figure 2 Results of Dropout Evaluation for LT Cells